Welcome! I’m glad you’re here.
Hi, I'm Jeremiah
Asemohor
I believe data is not just about numbers; it is about understanding people, solving challenges, and creating impact.
20+
Projects Done
4+
Years Experience
6+
Certifications


ABOUT ME
A little about
who I am
Hey there,
I am more than just a Data Analyst—I help businesses make sense of their data and turn it into decisions that drive real results. Whether it's messy spreadsheets, scattered databases or dashboards that need a fresh perspective, I enjoy transforming raw data into clear, actionable insights.
Here's how I approach every project:
- ✪ Understand the problem first. Before touching the data, I take time to understand your goals, challenges and the questions you need answered. The right solution always starts with the right understanding.
- ✪ Prepare the data. I collect, clean and organize data to ensure every analysis is accurate and reliable. Clean data is the foundation of meaningful insights.
- ✪ Analyze and visualize. Using Excel, SQL, Power BI, Tableau and Python, I uncover trends, build interactive dashboards and present findings in a way that is easy to understand and act on.
- ✪ Deliver insights that matter. I don't just build reports—I explain what the numbers mean, identify opportunities and provide recommendations that support smarter business decisions.
Beyond analytics, I also enjoy helping individuals and teams build confidence with data by simplifying complex concepts and creating practical solutions that are easy to use.
If you're looking for someone who combines technical expertise with a problem-solving mindset, I'd be glad to help bring your data to life.
Let's build something meaningful together. 🚀
STACK & TOOLS
Certifications
Learning never stops
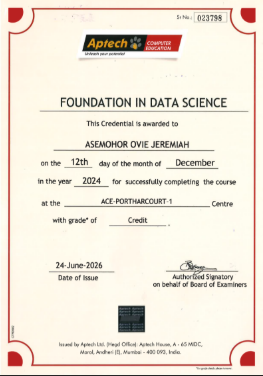
Data Science
Successfully completed the Data Science Professional Programme at Aptech Computer Education, gaining practical experience in data analysis, statistics, visualization and machine learning.
View Certificate →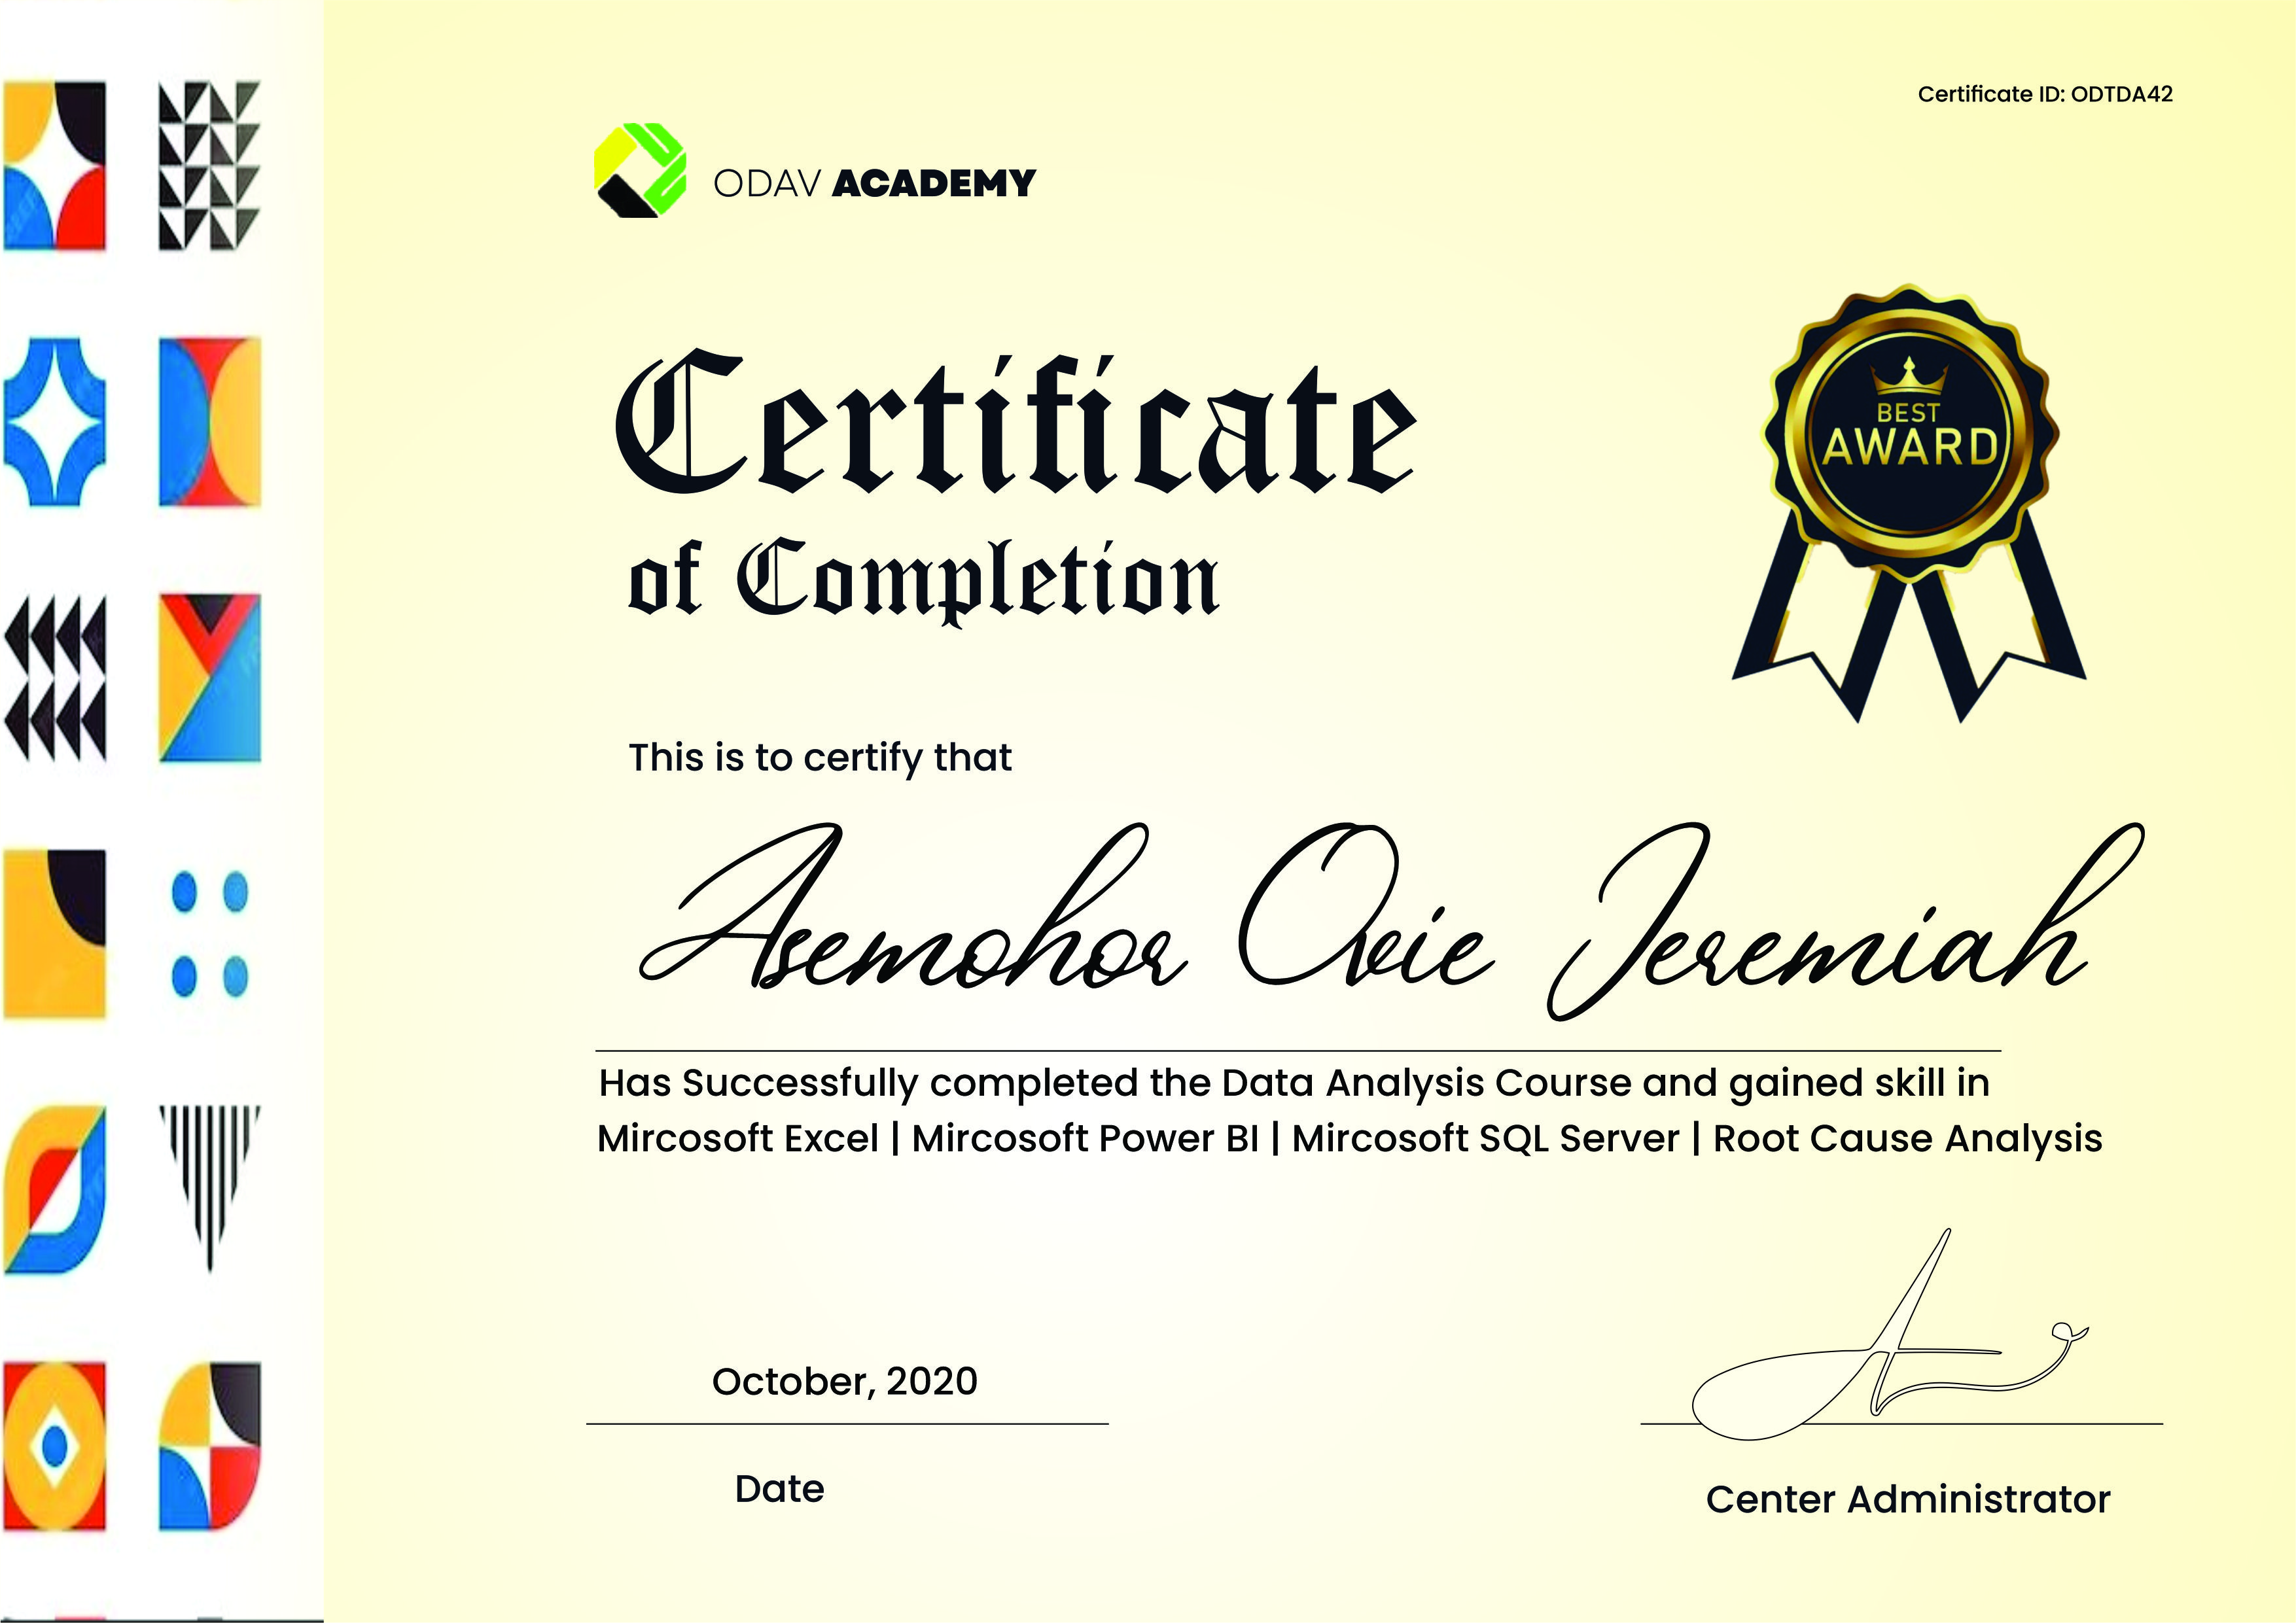
Data Analyst
Completed intensive training in data analytics at Odav Technologies with hands-on experience in Excel, SQL, Power BI and business reporting.
View Certificate →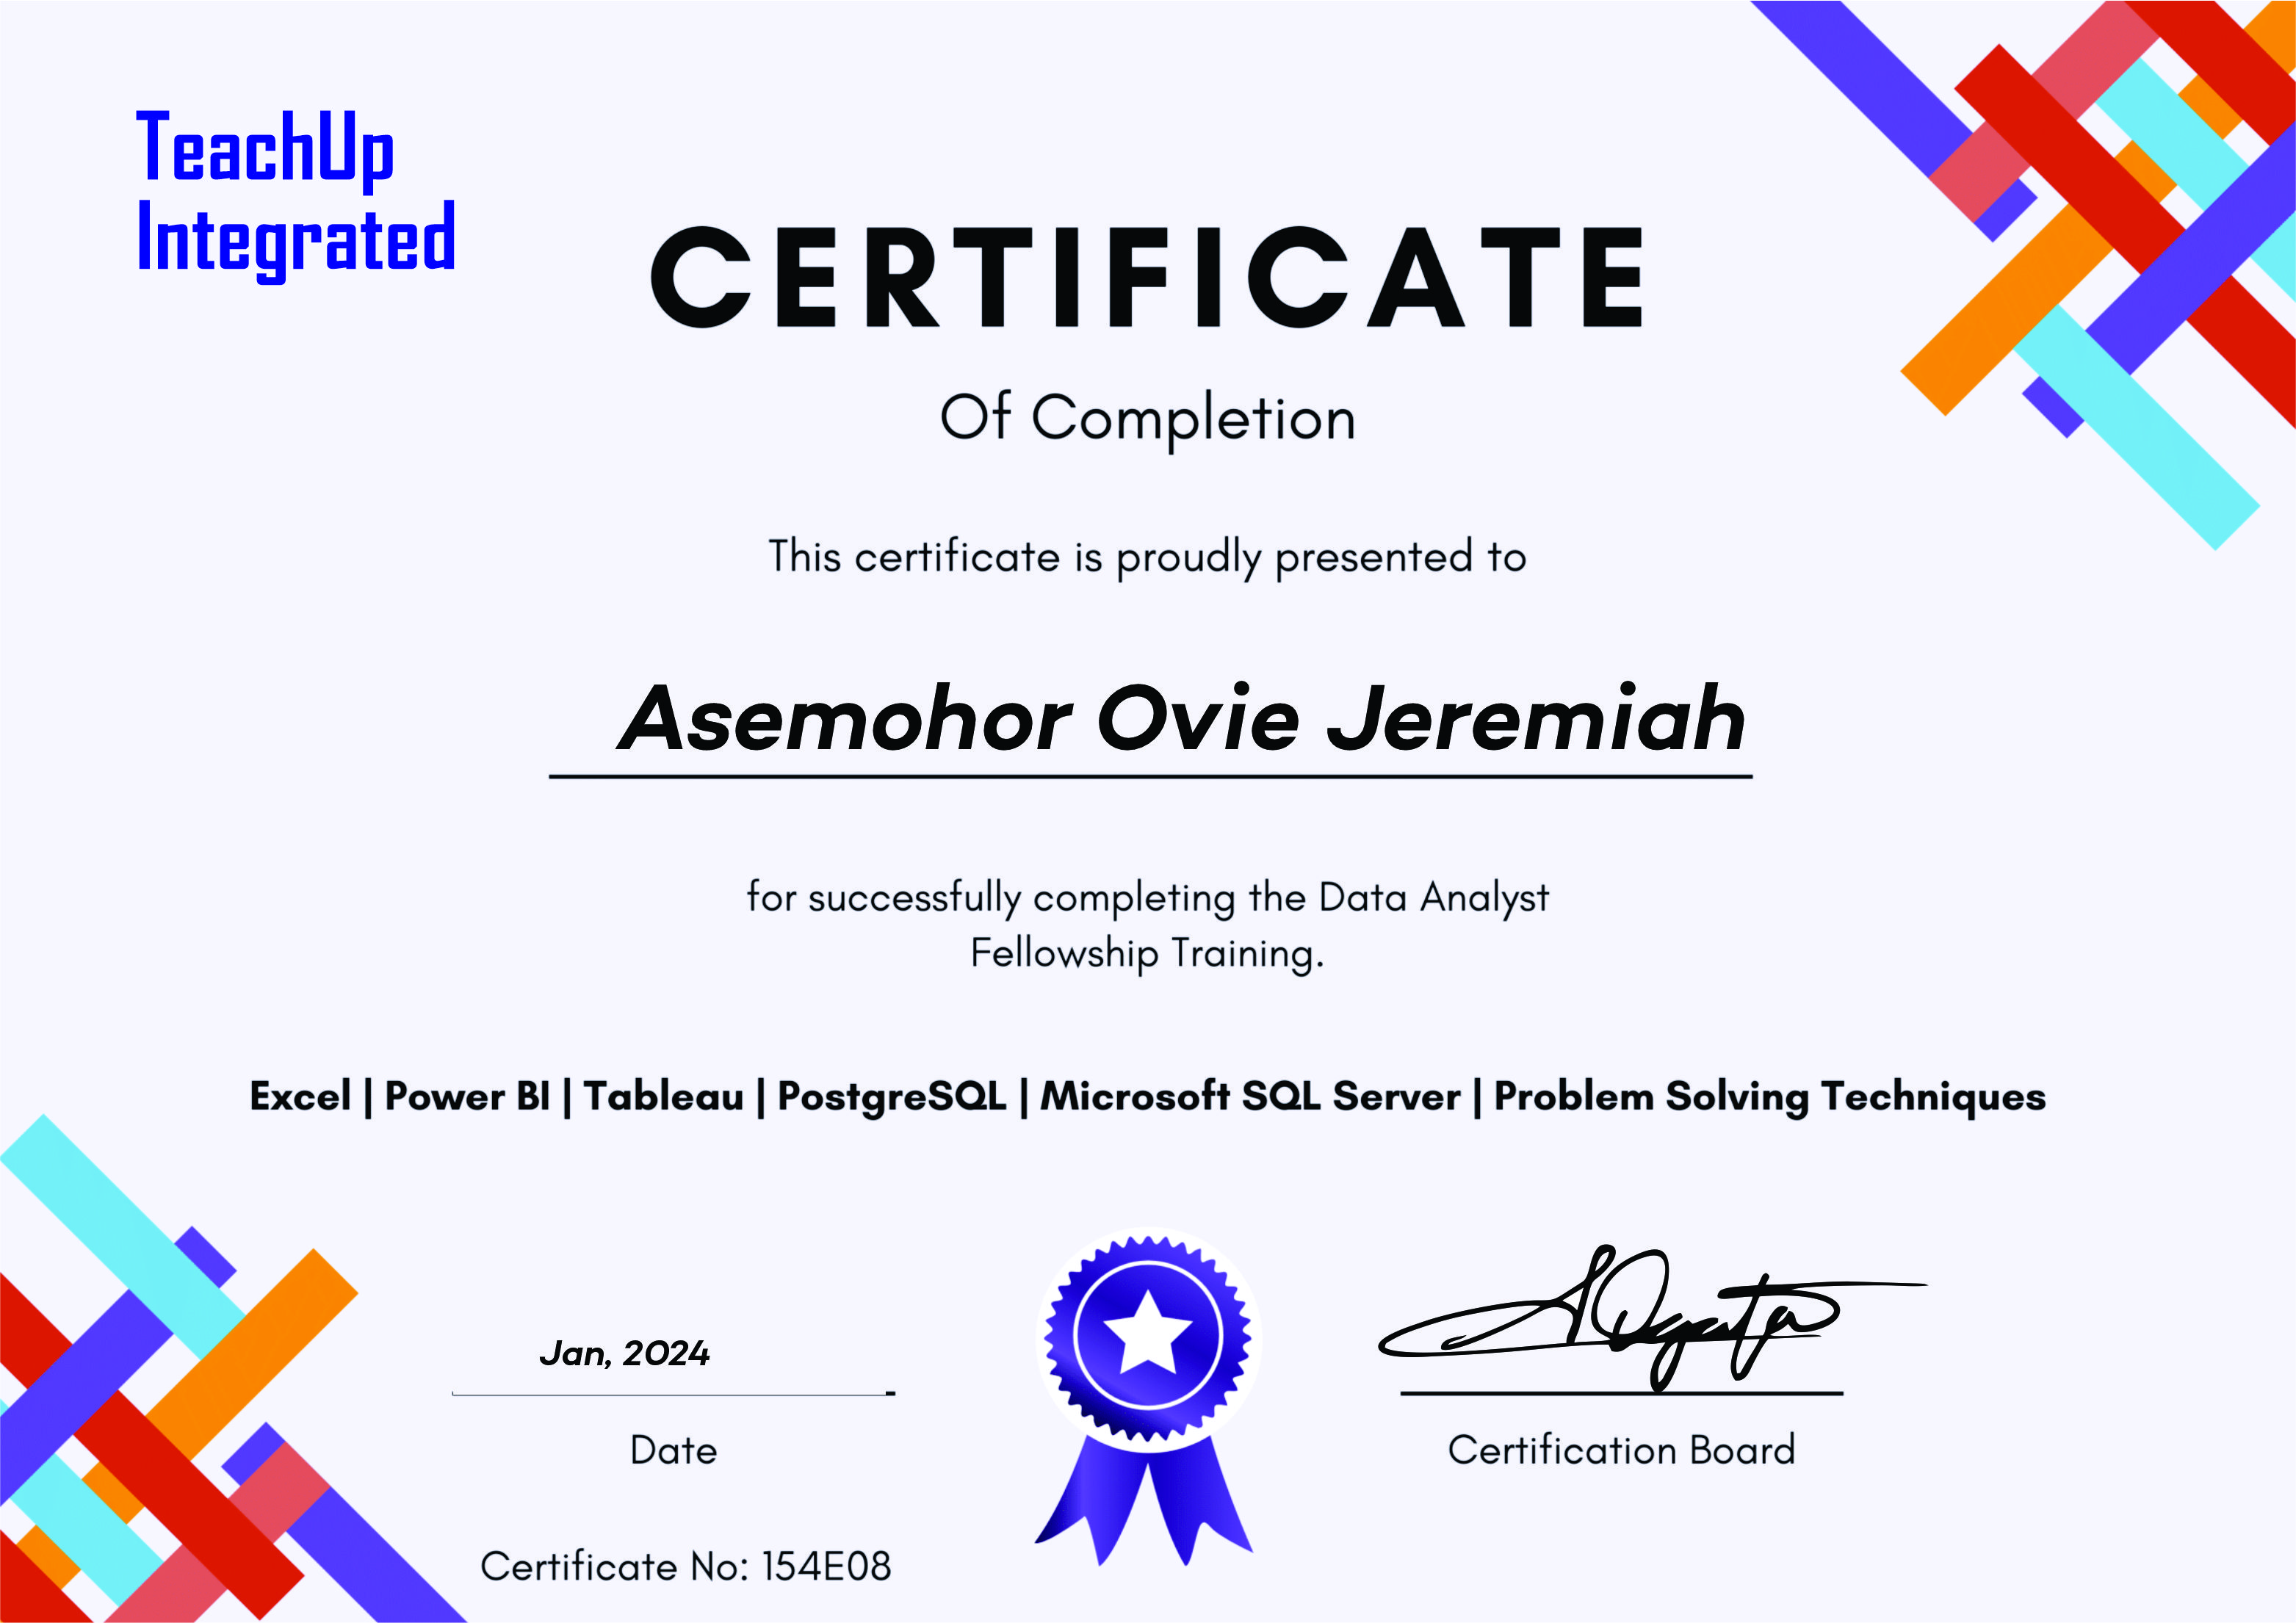
Data Analytics & Business Analytics
Advanced training in data analytics and business analytics, focusing on solving business problems through data-driven decision-making, dashboards and reporting.
View Certificate →Resume
My Professional Journey
A quick overview of my education, professional experience and technical expertise. Download my resume to explore my complete career journey.
Experience
Business Analyst
Odav Technologies
2020 - PresentImplemented data-driven reporting systems, developed Power BI and Excel dashboards, and improved operational efficiency by automating reporting processes and delivering actionable business insights.
Education
B.Sc Computer Science
University of Port Harcourt
Second Class Upper
National Diploma
Computer Engineering
Port Harcourt Polytechnic
Core Skills
Portfolio
Featured Projects
Real business problems solved using Excel, Power BI and Tableau. Each project includes the business problem, data preparation, key insights and recommendations.
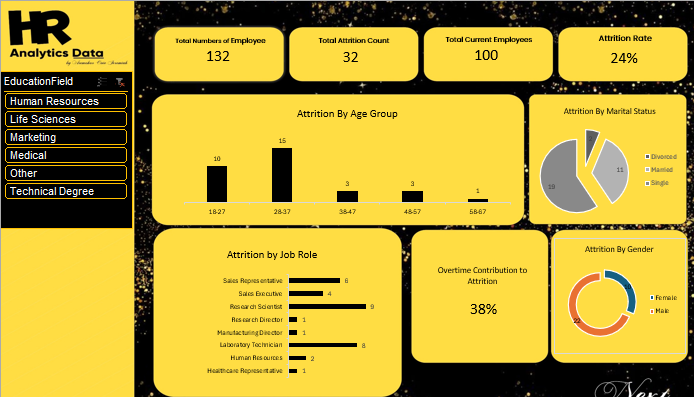
HR Attrition Analysis
ExcelDesigned an interactive Excel dashboard to analyze employee attrition, workforce demographics and departmental turnover. The analysis identified high-risk departments, job roles and employee groups to support better retention strategies.
Microsoft Excel • Power Query • Pivot Tables • Pivot Charts
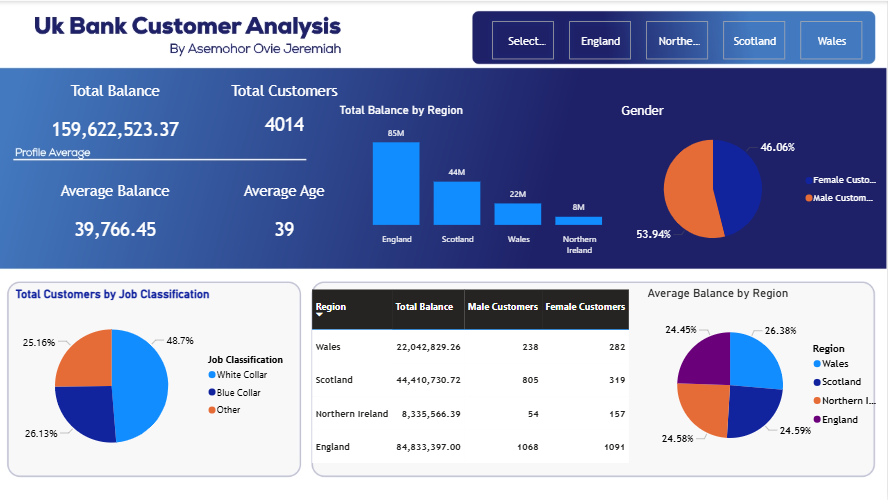
UK Bank Customer Analysis
Power BIInteractive Power BI dashboard analyzing customer demographics, balances, regional performance and customer segmentation across the United Kingdom.
Power BI • Power Query • DAX • Data Modeling
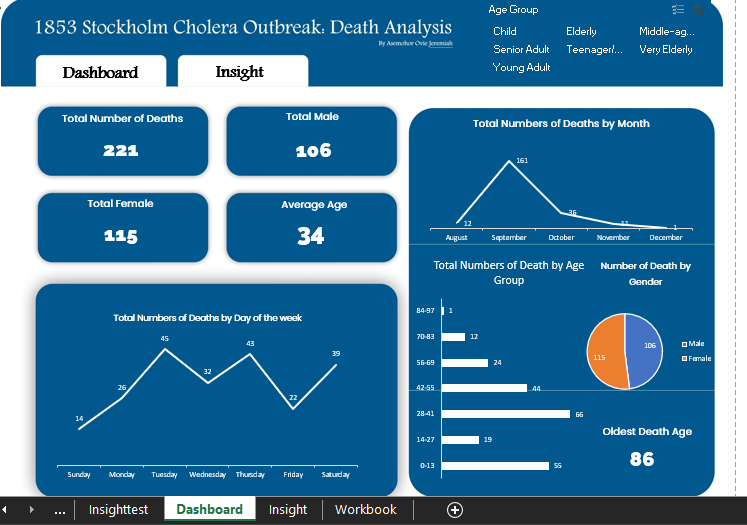
1853 Stockholm Cholera Outbreak
ExcelHistorical public health dashboard analysing mortality trends during the 1853 Stockholm Cholera outbreak.
Microsoft Excel • Power Query • Pivot Tables • KPI Dashboard
Contact Me
Let's work
together.
Whether you're looking for a Data Analyst, Business Intelligence professional, or someone to transform raw data into meaningful insights, I'd love to hear about your project. Feel free to reach out through any of the channels below.
jeremiahovie@gmail.com
Phone
+234 704 610 7022
Location
Port Harcourt, Rivers State, Nigeria
Connect with me
X (Twitter)
@jerryovie2